Not too long ago we were looking for a way to visualize a group of metrics across our entire fleet. Although you could render all of the metrics on one graph, it becomes nearly impossible to distinguish one from another. Jesse Newland (@jnewland) suggested that we look at Cubism.js' horizon charts. The nice thing about horizon charts is that you can cram a lot of information into a small vertical space, due to the way they render "overlapping" values with increasing intensity. One thing led to another, and soon Dusk was born.
This project started with the objective of identifying hotspots across a large number of systems. It remains true to this goal with a couple twists. I wanted to try and pack as many horizon charts into as compact a visual frame as possible, while still allowing the reader to discern one metric from another. When viewing a Dusk dashboard, each metric scales up as you hover over it. This is not as straightforward as you might expect. Because cubism uses a special canvas element that updates as new metrics arrive, you can't simply resize the height attribute. Rather, we accomplish virtually the same effect using the experimental scaleY CSS transform.
If you've tried out my other dashboard projects, you probably recognize that I dislike unnecessary configuration. With Dusk I took this one step further; I wanted to avoid any external service dependencies typically required for multi-user collaboration or state management. As such, this dashboard is almost entirely navigated from the URL. The sole exception is the concept of favorites, allowing you to "save" preferred dashboard views by starring them in the navigation bar. The catch here is that your favorites are stored entirely in your session cookie; delete your cookies or switch browsers and they will no longer be visible.
I believe the trade-off here is entirely worth it. Deployment and usage is ridiculously easy. Load a dashboard by appending a Graphite-compatible metric string (preferably with wildcards) at the end of the /metrics/ URI. For example:
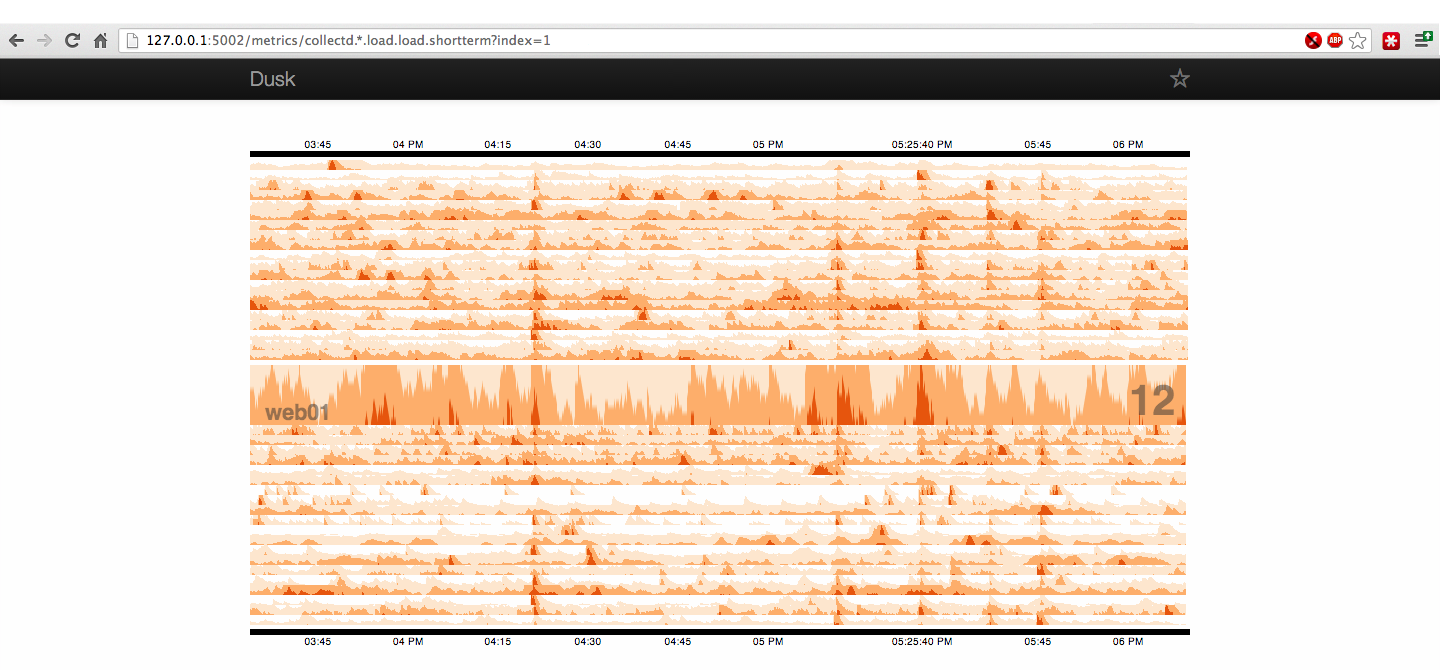
By default, Dusk uses the 2nd node in the metric path as the heads-up name. This particular node was chosen because Collectd typically sets the hostname in that part of the metric path and it's expected that most users will use the wildcard there. You can override this by passing the zero-indexed value in the URL with the index parameter.
Dusk is not your typical dashboard application. It's goals are simple and finite. It's great for experimentation but I would never recommend it as your primary dashboard interface. Nevertheless, I think it serves an important purpose in identifying hotspots and host activity patterns. If you get a chance to try it out I welcome your feedback.